All crossed up … or down…
When we are looking at indicators oftentimes we can see that an automated trade, a strategy, might be useful to take action when particular events such as a line crossing occurs. But once we have spent invested the effort in building the strategy we find that it does not perform how we had hoped and expected.
One of the traps is that strategies operate differently to indicators. Where indicators update what we can see on the charts each time the prices changes ( each ‘tick’), strategies only update at the close of each time period, and unless we have an equivalent indicator running we cant see why a strategy does or does not take action.
One pair of tools we can use in strategies are the CrossUp and CrossDown functions to recognise if one line has crossed another line.
Using the CrossUp(red_line,blue_line) or CrossDown(red_line, Blue_line) function basically compares the last two points of each line.
For CrossDown, if the second last point of red_line is above or equal to the second last point of blue_line, and if the last point of red_line is below the last point of blue_line then the function returns true.
Whether we use these provided functions or write our own, there is often confusion and frustration when we can see that lines have crossed but the strategy does not take any action… often though the difference is because of our perception…
Lets look at a fictional chart…
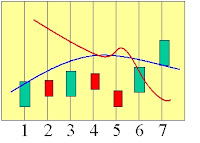
Here looking at the lines if we have a strategy that trades short when red crosses down through blue, we might expect a trade to go off at candle five and/or at candle six.
First thing we need to accept is that a ‘line’ on a chart is only a series of points.. the connections between each point are fictional, just there for our human eyes.

What the computer, your CTL program sees is this…

Lets see now how this pans out over time..
We start looking at the end of period 3. The red line is heading down, and blue is heading up… maybe something will happen but we all know it hasn’t happened yet…

As period 4 ticks by (but is not yet complete) it looks like red is crossing down over blue.. Below is how we see the lines drawn…

… this is how an indicator would see it at some instance during the candle..

But this is how a strategy still sees it …
Because our strategy does not run yet as the candle has not finished… we agonise while we wonder why the strategy is not doing anything…
Waiting a while longer… the candle finally closes and looks like this…

At the end of the 4th period whe the strategy would finally run, we can see that in the end the lines have not crossed… this is the ‘reason’ for strategies not running until the end of a period.
So, we have to wait longer…..

Now at the end of period 5, we can see the lines… it looks like our strategy should open a trade.. but if we look at it how CTL sees it…..

Now we can see that the points of the lines have not actually crossed…. This is correct ~ and beneficial… for such a brief crossing most of us would not want to start the trade…
So.. wait some more

Now at the close of the 6th period we have our points finally crossing..
So now… we expect to see our trade… however we need to remember that at this point in time candle six has closed… and period 7 is about to open. Our CTL strategy will run before period 7 is begun. It would be confusing to show a trade opening on period 6 now.. because the trade did not open then.
The strategy will issue the trade command (eg buy(1)) but we wont see that until period 7 gets underway…..

now we see the trade…
Even though the ‘lines’ crossed between 4 and 5 the points did not.. so no trade..
Then we ‘see’ the lines have crossed at the close of 6… but the trade is actioned in the beginning of period 7.. so it looks ‘late’.

and at the end of period 7 it looks like this…