Home


These pages discuss some of the features and uses of the Dealbook360 Chartstudio CTL language, along with some tips on getting started, and how to get and use some extensions to the language.
There is no attempt to discuss trading methods, ideals or management, and it is assumed that you have some experience in using Dealbook itself.
Any information given here is from personal experience and research and while given in good faith, i can not and do not offer any guarantees or warranties on the use of the information. Anything we try should be well tested and assessed with demo accounts before thinking of using real $$.


Site Content
>>Home
What is CTL?
How CTL runs
Attributes of Strategies, Indicators and Functions
CTL 101 How to write and run a CTL
All crossed up/down

Extended CTL Features

Other CTL links


Custom Search


What is CTL?

CTL is an acronym for Common Technical analysis Language. It is a proprietary programming language, as far as I know only used for the Dealbook software. CTL can examine and work with chart data within an active Dealbook chart to display more information and/or to take some action, such as automatic trading or sms notifications.

Three types of programs can be created using CTL for use in your charts.
1) Strategies: Used to automatically notify or place and close trades based on calculations of chart data.
2) Indicators: Used to calculate and display information as lines on charts.
3) functions: routines that can be called by strategies and indicators

CTL is not a particularly user-friendly language.. generally I would say it is harder to understand and less flexible than VBA (Visual Basic as found in Word and Excel macros).. and while easier to read than C++, is much less powerful.
The biggest issue I have had is the lack of debugging although this has been improved recently with the 'prinf' function.
There is little access to data outside of the chart that the CTL program is running in.


Site Content
Home
>>What is CTL?
How CTL runs
Attributes of Strategies, Indicators and Functions

Extended CTL Features

How CTL Runs


There are differences between how Strategies and Indicators operate.
Indicators:
For each tick (every price change) on the chart, your CTL program will run.
On each run all variables will be reset and recalculated.
Any input variables will be set to last settings in each individual chart.
However if the chart, or Dealbook, is closed before "saving the current layout" the next time Dealbook is started the input variables will be as of the last saved settings.
There is no current 'native' way to save any calculated values for later use.
Depending on what kind of calculations are done to make your new line, since at each tick all "Input" type variables are set back to the chart setting, and all other variables are reset, some kind of loop in your program is needed to recalculate the line on each tick. This can cause some amount of overhead when several charts, perhaps each with several CTL programs running need to recalculate everything every tick.
Strategies:
When a Strategy is opened (attached to a chart) it will first run through each period (candle, bar, point) of the chart, running the CTL program anew at each. Depending on your CTL code, this can cause Dealbook to ‘lockup’ while it traverses the whole chart’s data. Once started the Strategy CTL runs only at the Open of a new period.
As with indicators, strategies will reset variables at each run.

Functions:
Functions are (generally) short reusable routines that can save time and make code more readable. Functions can be called from indicators and strategies. Functions can only return 1 value or 1 series.


Site Content
Home
What is CTL?
>>How CTL runs
Attributes of Strategies, Indicators and Functions

Extended CTL Features

Attributes of Strategies, Indicators and Functions.

Overview


Functions
A function can be called from a function.
A function can be called from an indicator.
A function can be called from a strategy.
A function can receive multiple inputs of type bool, number, series and string.
A function returns one ‘result’ which may be a bool, a number, a series or a string.
A function may call another function.
A function may call an indicator.
A function cannot call a strategy.
A function cannot do ats commands.
A function cannot draw to a chart.
A function can write to the debug window.
A function can write to a file.


Indicators
An indicator can be called from a function.
An indicator can be called from an indicator.
An indicator can be called from a strategy.
An indicator can receive multiple inputs of types bool, number, series and string.
An indicator returns one or more line series defined in the ‘draw’ statement.
An indicator may call a function.
An indicator may call another indicator.
An indicator cannot call a strategy.
An indicator cannot do ats commands.
An indicator can draw to a chart.
An indicator can write to the debug window.
An indicator can write to a file.


Strategies
A strategy cannot be called from a function.
A strategy cannot be called from an indicator.
A strategy cannot be called from a strategy.
A strategy can receive multiple inputs of bool, number, series and string.
A strategy returns no results.
A strategy may call a function.
A strategy may call an indicator.
A strategy cannot call another strategy.
A strategy can do ats commands.
A strategy cannot draw lines to a chart, but can place trade related indicators.
A strategy can write to the debug window.
A strategy can write to a file.


Site Content
Home
What is CTL?
How CTL runs
>>Attributes of Strategies, Indicators and Functions

Extended CTL Features


CTL 101

How to make a CTL program and how to run it?


There are two types of programs you can write in CTL, Indicators and Strategies.
Indicators are used to display some visual information about the chart data either for manual trading or as development tools and final input to Strategies.
Strategies are programs that can do something... ultimately to place and close trades automatically.

Assuming you have very little programming experience first we will make an Indicator program that does nothing but print the veritable "Hello World" message. Printing in CTL is restricted to either the ‘debug window’ or to a file. We cannot print any text to the chart window .

To write a CTL you could use any text editor… but to compile the program (to make it useable in Dealbook) we need to compile it in the ‘Integrated Development Environment” or IDE, otherwise known as Chartstudio. The IDE is a combined editor and compiler that also registers a successfully compiled program to Dealbook.

After installing Dealbook there should be a desktop icon called Chartstudio, as well as a Chartstudio item in the start>programs>global forex trading folder. (or WH SELFINVEST if you have Prostation).

Double click the Chartstudio icon, then click or click the ‘new document’ icon in the tool bar. You should be presented with a blank page called ‘File1’. Enter the following code…
indicator HelloWorld;
draw myLine("myLine");
begin
print("hello World");
end.


Now find the lightning bolt icon to click (or press F7, or select from the menus).
You will now be prompted for a file name to save your program to. It is good practice to make the file name the same as the indicator or strategy name. Another useful practice is to suffix the indicator names with “_I” and strategies with “_S” following the same with the file name. Sometime in the future you will have indicators and strategies that are based on the same formulas and will need to differentiate them. So our HelloWorld indicator should be named “HelloWorld_I” and the file name also “HelloWorld_I”. This will then save you program as “HelloWorld_I.ctl”.

The verify process will confirm there are no syntax errors in your program, that is, the format of the instructions are correct… there may still be logic errors in how you are telling it to operate – we’ll deal with that another day.

Now find the “Output” tab which by default will be at the bottom of Chartstudio (but may be dragged to other places). Assuming you typed everything as above, and changed the name to HelloWorld_I, you should see the message
“Verifying file: C:\…… \HelloWorld_I.ctl”
“Done”

CTL programs need to follow a structured layout in order to compile. The first and obvious thing is to tell the compiler and Dealbook what kind of program this is and give it a name that we can all recognise.
indicator HelloWorld_I;
This name must be unique, no other compiled program can have the same name ~ actually if you do have the same name the existing one will be replaced, unless it is a ‘system’ indicator, one that was supplied with deal book. Names must start with a letter and can then contain numbers and letters but not spaces or special characters.
CTL is not a case sensitive language but many programmers use upper and lowercase to improve readability.

In our HelloWorld program we have skipped some optional sections that we will come back to. However, in an Indicator we must have a “draw” section since that is the primary purpose of an indicator – to draw some lines on the charts. In our program here we don’t use the line, but we must define at least one.
draw myLine("myLine");

Again we skip some optional declaration sections and identify that we are going to write some code. The first part of the coding section is
Begin
This must also have a matching end at the very end of the program.

Now we finally do something, tell Dealbook to write the text “Hello World” to the ‘debug window’.
print("Hello World");
The print statement only writes readable text, not numbers, but we can convert numbers for printing using the numbertostring() function ~ later.

Finally our program must end… the “end” statement of the program is terminated by a dot (full stop/period).
end.

Compile your program by finding the “Install” icon or menu item.

After a good compile resulting in the message “Module Installed Successfully” in the ‘Output’ tab we are ready to attach it to a chart.

Open Dealbook and get a chart running (Dealbook can be open while developing CTL programs).
Find the ‘Setup Indicators” icon on the toolbar, or right click the chart and click “Add Studies” near the bottom of the popup window. If you used the “Setup Indicators” icon you will have the “Chart Indicators” window, now click “Add” at the bottom left. You should now see the “New Indicator” window with a list of compiled and installed indicators. Scroll through to find, or type the name of our new indicator “HelloWorld_I”. Highlight it with a single click, don’t double click… first we need to uncheck the “Add on new subgraph” box.


Now click “ok” on the “HelloWorld_I parameters” window.
On the Dealbook menu bar navigate to and click
We should have at least one message “Hello World”.. probably more as it will print every time there is a price movement on the chart you attached to.Find the ‘Setup Indicators” icon on the toolbar, or right click the chart and click “Add Studies” near the bottom of the popup window. If you used the “Setup Indicators” icon you will have the “Chart Indicators” window, now click “Add” at the bottom left. You should now see the “New Indicator” window with a list of compiled and installed indicators. Scroll through to find, or type the name of our new indicator “HelloWorld_I”. Highlight it with a single click, don’t double click… first we need to uncheck the “Add on new subgraph” box.


So that’s it.. a very sedate and almost useless indicator… but.. the print function is very useful for debugging programs.. I expect you will learn to use it a lot !

All crossed up … or down…

When we are looking at indicators oftentimes we can see that an automated trade, a strategy, might be useful to take action when particular events such as a line crossing occurs. But once we have spent invested the effort in building the strategy we find that it does not perform how we had hoped and expected.

One of the traps is that strategies operate differently to indicators. Where indicators update what we can see on the charts each time the prices changes ( each ‘tick’), strategies only update at the close of each time period, and unless we have an equivalent indicator running we cant see why a strategy does or does not take action.

One pair of tools we can use in strategies are the CrossUp and CrossDown functions to recognise if one line has crossed another line.
Using the CrossUp(red_line,blue_line) or CrossDown(red_line, Blue_line) function basically compares the last two points of each line.
For CrossDown, if the second last point of red_line is above or equal to the second last point of blue_line, and if the last point of red_line is below the last point of blue_line then the function returns true.

Whether we use these provided functions or write our own, there is often confusion and frustration when we can see that lines have crossed but the strategy does not take any action… often though the difference is because of our perception…

Lets look at a fictional chart…
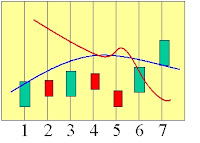


Here looking at the lines if we have a strategy that trades short when red crosses down through blue, we might expect a trade to go off at candle five and/or at candle six.

First thing we need to accept is that a ‘line’ on a chart is only a series of points.. the connections between each point are fictional, just there for our human eyes.


What the computer, your CTL program sees is this…


Lets see now how this pans out over time..

We start looking at the end of period 3. The red line is heading down, and blue is heading up… maybe something will happen but we all know it hasn’t happened yet…


As period 4 ticks by (but is not yet complete) it looks like red is crossing down over blue.. Below is how we see the lines drawn…


… this is how an indicator would see it at some instance during the candle..


But this is how a strategy still sees it …


Because our strategy does not run yet as the candle has not finished… we agonise while we wonder why the strategy is not doing anything…

Waiting a while longer… the candle finally closes and looks like this…


At the end of the 4th period whe the strategy would finally run, we can see that in the end the lines have not crossed… this is the ‘reason’ for strategies not running until the end of a period.

So, we have to wait longer…..


Now at the end of period 5, we can see the lines… it looks like our strategy should open a trade.. but if we look at it how CTL sees it…..


Now we can see that the points of the lines have not actually crossed…. This is correct ~ and beneficial… for such a brief crossing most of us would not want to start the trade…
So.. wait some more


Now at the close of the 6th period we have our points finally crossing..
So now… we expect to see our trade… however we need to remember that at this point in time candle six has closed… and period 7 is about to open. Our CTL strategy will run before period 7 is begun. It would be confusing to show a trade opening on period 6 now.. because the trade did not open then.
The strategy will issue the trade command (eg buy(1)) but we wont see that until period 7 gets underway…..


now we see the trade…
Even though the ‘lines’ crossed between 4 and 5 the points did not.. so no trade..
Then we ‘see’ the lines have crossed at the close of 6… but the trade is actioned in the beginning of period 7.. so it looks ‘late’.


and at the end of period 7 it looks like this…

Comments

If you have some useful or encouraging comments ....

Search Results